HortControl 3.4 release – Color segmentation, Correlation module and more
At Phenospex we are continuously working on improving our products. Today we are happy to announce a new HortControl release, which improves the usability and will increase your phenotyping productivity. Here is a short overview
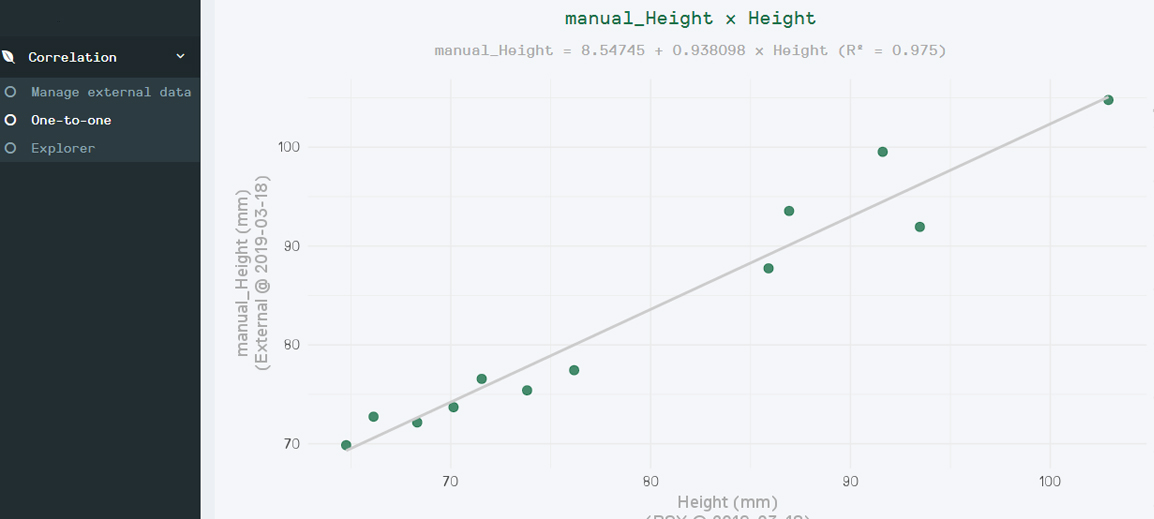
- Correlation analysis module easily compare manual & external data
- Color segmentation for better plant analysis
- 3D Grid for easier experiment set up
- And more…
New Correlation analysis module
Compare PlantEye data with manual or third-party data. For instance, compare your height measurements with our measurements in a one-to-one correlation. Or use the explorer to see which of our parameters correlate best with your visual scores.
Color segmentation
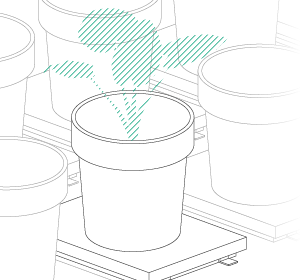
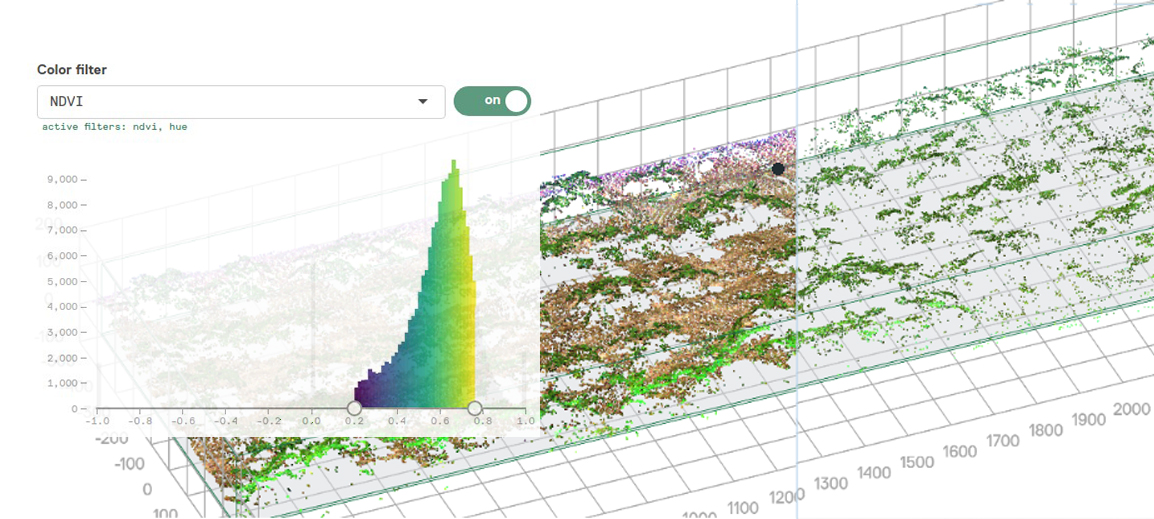
Set thresholds in a color histogram for all spectral parameters. This way you can filter everything you don’t want to be measured from the 3D file. Filter artifacts like pots, soil or cabling or get very precise measurements of pods and flowers by filtering the rest of the plant.
3D grid for easier experiment set up
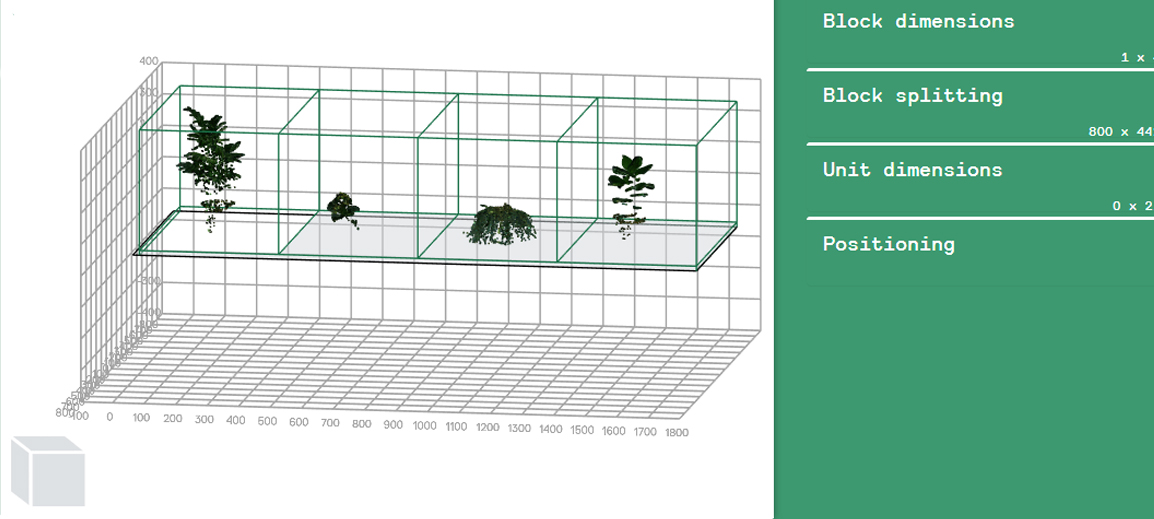
A 3D grid is added to the 3D view to gives a sense of dimensions when splitting the blocks. This makes it easier to compare the 3D view with the real situation.
Other updates
- Option to edit network settings
- Position information for each block within Reprocessing tool.
- Diskguard can be set for NFS mounts.
Want more information?
Our support, sales, R&D and operations team is happy to help with all your questions and requests. Just send us a message or give us a call!
How to update your HortControl?
All HortControl users with a license will be updated by our support team. No license? Contact us and ask for your update possibilities.
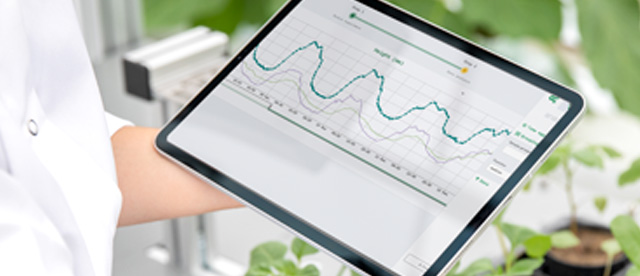
HortControl visualizes and analyzes your data:
- Set up and monitor your trials
- Data management, visualization and data export functions
- Automated reporting functions
HortControl is the central software to setup, visualize and analyze your PlantEye measurements. Read more about HortControl and our automation process.

