Syngenta Biologicals: Digital screening to detect the subtle effects and their timing
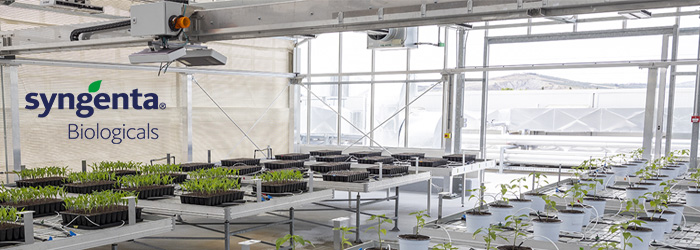
Syngenta, a global agrochemical company, has significantly increased its investment in biostimulants to align with evolving regulatory changes aimed at reducing the environmental impact of agriculture. In 2020, Syngenta acquired Valagro and formed Syngenta Biologicals, combining Syngenta’s global reach and Valagro’s proprietary technology to create a world-leading biologicals business grounded in science-based innovation.
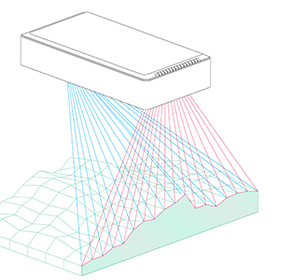
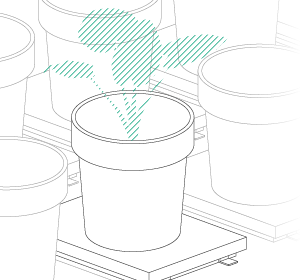
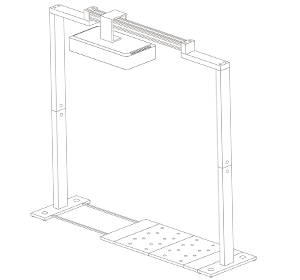
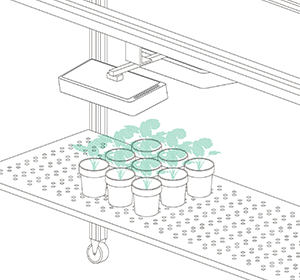
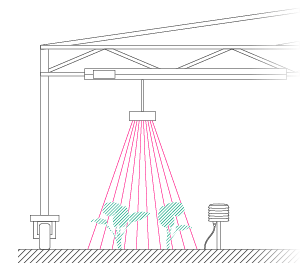
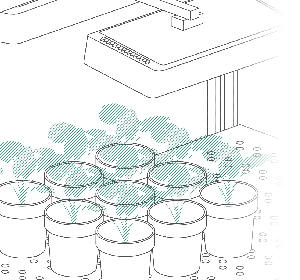
To minimize false negatives, Syngenta Biologicals adopted FieldScan, our high-throughput, space-optimized gantry system. It automates phenotyping in both field and greenhouse conditions, and provides non-destructive time-series data in real-time. With FieldScan, Syngenta Biologicals now captures reliable data and makes confident biostimulant research decisions with a team of just two people.
Biostimulants & their hard-to-detect effects
In the traditional agrochemical development process, the R&D teams screen hundreds of candidate chemicals, applying each to approximately three replicates in a greenhouse setting. This approach is expensive and prone to errors, involving the cultivation of thousands of plants and relying on single, manual end-point measurements. These can take hours to complete, creating data accuracy issues due to the biological diurnal effects caused by the significant time gap between the first and last plant measured. The primary concern for researchers is the risk of false negatives – missing an effect and subsequently discarding a potentially valuable chemical. This oversight can result in millions of dollars in missed market opportunities.
However, increasing the number of replicates to mitigate this risk isn’t feasible due to the high cost of greenhouse space and the sheer volume of chemicals requiring screening. Consequently, the success of the screening process heavily depends on the quality and quantity of data collected from the limited replicates.
The need for highly accurate and reproducible data is even more pronounced with biostimulants, which might exhibit subtler, more uncertain, and short-term effects that are difficult to detect. Therefore, Syngenta Biologicals was eager to adopt tools that could deliver the high data quality required to identify and analyze any phenotypic effect.
Mirella Sorrentino, Plant Phenomics Specialist at Syngenta Biologicals, explains: “It’s much easier to miss a biostimulant effect. First, missing an effect because of the low sensitivity of traditional methods in capturing variable effects. Secondly, missing an effect simply because we weren’t measuring the relevant parameters. Thirdly, missing an effect that had occurred and then diminished by the time we conducted the end-point measurement.”
Screening for growth effects with Phenospex’s real-time technology
To address these challenges, Syngenta Biologicals leveraged Phenospex’s advanced phenotyping solutions. Using Phenospex’s real-time technology, Syngenta Biologicals recently conducted an experiment on the biostimulant effects of leads on plants in nitrogen-deficient conditions. It involved four treatments with five replicates each:
- Negative Control (NC): Plants watered with a nitrogen-deficient solution
- Positive Control (PC): Plants watered with a nitrogen-sufficient solution
- Treatment 1 (T1): Plants watered with a nitrogen-deficient solution and treated with an added biostimulant lead
- Treatment 2 (T2): Plants watered with a nitrogen-deficient solution and treated with another added biostimulant lead

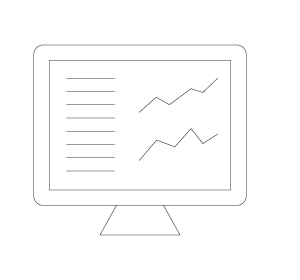
The experimental setup involved twice-daily scans, with FieldScan completing scans of all the plants in the greenhouse within 20 minutes. The data was accessible in real-time via HortControl, enabling the team to validate experimental conditions and begin analyzing biomass changes immediately.
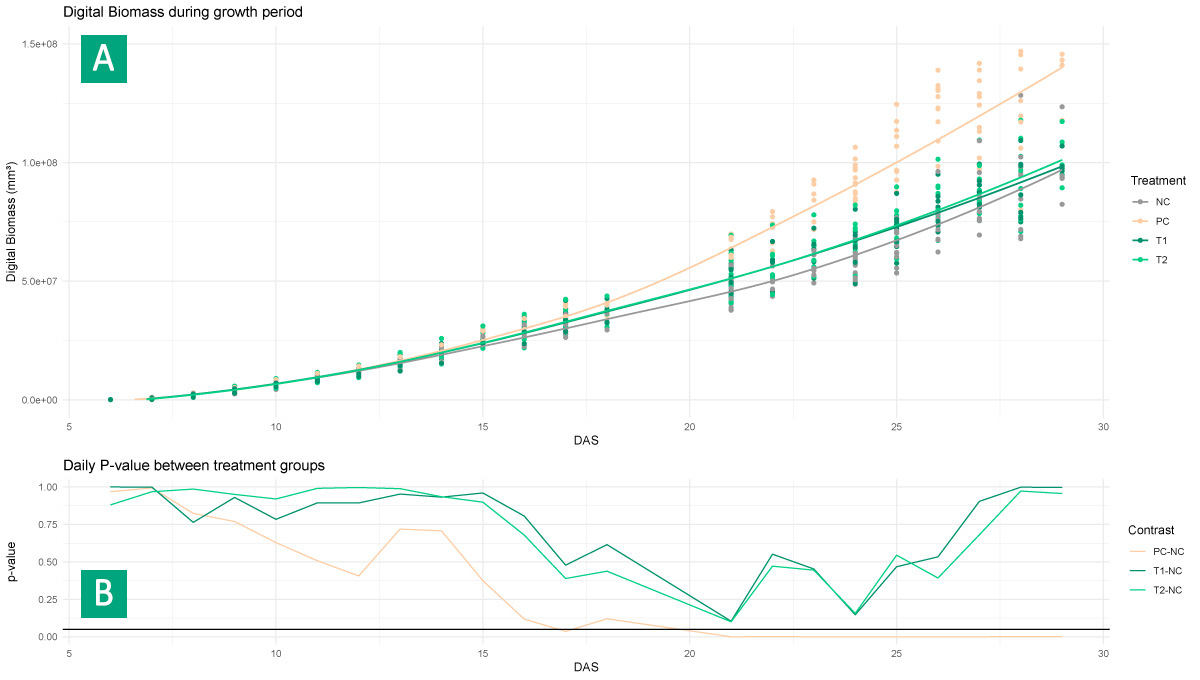
Figure 1: Aggregated daily differences in Digital Biomass (mm³) among treatment groups (NC: Nitrogen Deficient, PC: Nitrogen Sufficient, T1: Treatment 1, T2: Treatment 2) throughout the trial period. Panel A displays a scatter plot of the non-destructive Digital Biomass (mm³) for each experimental unit from 5 to 29 Days After Start (DAS), with a local polynomial regression fitted to each treatment group to illustrate growth dynamics. Panel B presents daily evaluations of the treatment groups using a two-sided Student’s t-test, with the resulting p-values depicted as a line graph. The significance threshold of 0.05 is marked with a thick dark gray line.
Statistical analysis showed a significant difference between PC and NC after 16 days. Although T1 and T2 treatments approached statistical significance compared to NC, these differences were not maintained by the end of the experiment.
The experiment was concluded on Day 29 when the observable effects had diminished. This decision was based on real-time monitoring and analysis, which allowed for the precise identification of transient effects that would have been missed with end-point measurements.
Based on the initial screening results, these agents will now undergo further screening by the agronomy team, continuing in greenhouse conditions up until yield.
“We’re now confident that we’re not missing effects”
Reflecting on the benefits of implementing Phenospex’s solutions, Syngenta Biologicals values the ability to automatically scan plants and monitor data in real-time as this significantly reduces the labor required for each experiment. It minimizes the need for a physical presence in the greenhouse, allowing the team to identify issues remotely and reducing the stress associated with safeguarding a successful experiment.
The team can also start analyzing standardized and reliable 3D data instantly, instead of waiting 3-4 weeks for the raw data to be analyzed and parameters to be calculated. Phenospex’s 3D processing chain instantly delivers over 20 parameters on morphology and physiology, including leaf area, digital biomass, and NDVI. Ana Martinez Ascanio, Plant Physiology Manager at Syngenta Biologicals, notes that this is particularly helpful in biostimulant research when they often don’t know what effect they’re looking for. “By having so many uniquely valuable parameters, we can define the combination of variables that measure the trait required and detect effects we would otherwise have missed.”
By replacing end-point measurements with real-time data, the team has the confidence that they’re not missing short-term effects. “The precise point of the effect is important. When is the plateau reached? If we measure too late, there’s a chance we’ll miss the effect.” Mirella adds: “By pinpointing exactly when an effect occurs and its duration, we can determine the best time to apply agents, ensuring they produce effects at optimal times.”
Once an effect is seen, the team can quickly make decisions to maximize research productivity. “We can shorten experiments once an effect is seen and start a new experiment faster, or we can choose to extend an experiment to get more valuable data about an effect,” explains Mirella.
Syngenta Biologicals’ verdict
Syngenta Biologicals has found Phenospex’s technology and support invaluable in overcoming phenotyping challenges. “In such a fast-evolving regulatory and technological environment, having a partner who can provide robust support and adapt to our changing needs is crucial. The Phenospex team is highly responsive and knowledgeable – they are devoted to helping us achieve our goals,” says Ana.
Discover FieldScan or speak to our team to learn more about improving your agrochemical research.