The Power of Fusing 3D with Multispec
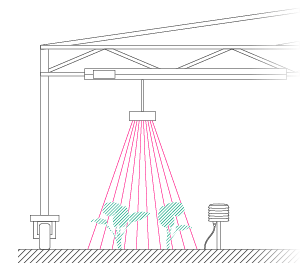
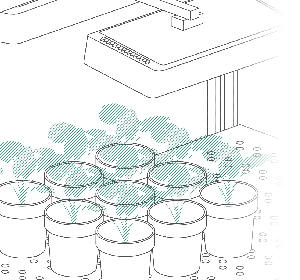
3D assessment of plants became a commonly used technology in plant phenotyping to measure morphological and architectural features of plants. Although, 3D sensors such as PlantEye can be the workhorse for every phenotyping platform, it still lacks the ability to measure changes in color or other spectral information that are an important indicator for the plants physiological status.
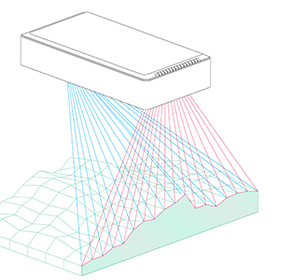
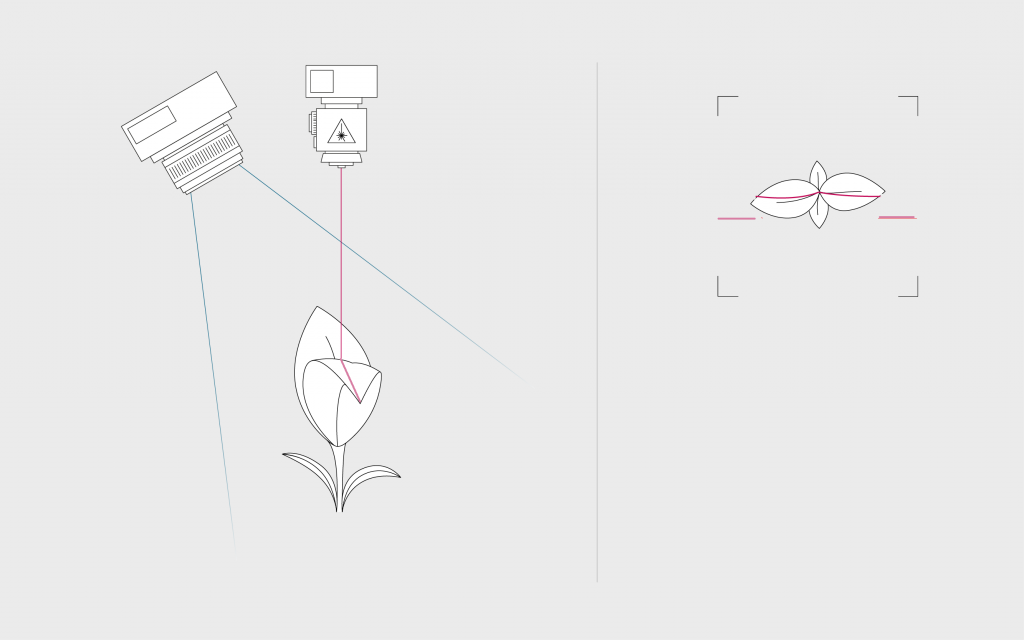 Measurement concept of 3D light section scanners. A laser line (red) is project vertically on the plant. A camera (blue) captures the reflection of the laser line under a certain angle. The image of the camera can be seen on the right. Based on the displacement of the laser line in the image the height of each point along the line can be calculated.
Hyperspectral sensors gained rising attention in plant phenotyping as they deliver a great insight into the spectral absorbance of plants. Yet, working with hyperspectral cameras remains a computationally challenging- and a financially intense endeavor. In addition to that, the spectral reflectance of plants strongly varies with the imaging conditions, such as leaf angles or distances from the sensor. To overcome that issue, spectral indices can be computed, which is a ratio of one or more wavelengths that is used to normalize the data. Hence, you compare only the spectral regions that typically have different absorption rates depending on the plant status. An easy example for a two-band index is the Normalized Digital Vegetation Index (NDVI) that compares the red reflection with the red or green reflection to differentiate vegetation from non-vegetation such as soil.
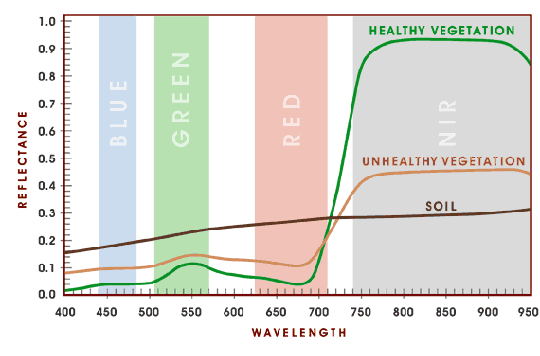
Reflectance properties of healthy and unhealthy vegetation compared to soil. Instead of measuring all bands in the visible range, multispectral cameras take certain areas and measure the spectral information in these ranges. Often these ranges are characteristic enough for the full spectrum and can be used to differentiate between soil and vegetation.
In routine digital phenotyping or other agriculture related applications, when assessing the vegetation indices such as NDVI, it is mostly not necessary to measure the full spectrum with a hyperspectral sensor, but just the spectral bands of interest with a multispectral camera. This reduces costs, complexity and computational efforts. Nevertheless, these cameras do depend on imaging conditions.
PlantEye F500: Fuse 3D with Multispectral information
Many of the mentioned challenges in hyper- or multispectral imaging can be overcome with depths information resulting from 3D imaging. These methods combine the information from a 3D scanner with other sensors. This approach is computationally complex, since image data from different sensors needs to be registered and corrected for differences between the imaging settings. When taking multiple images with different sensors one after another – as often done in conveyor systems – the images are taken at different time points (multi-temporal problem). The plant itself might have changed its shape between the two measurements. When both sensors are mounted next to each other the perspective of the plant in both images is different (multi-view problem). Although, this is easier to solve than a multi-temporal problem it still requires good registration processes.
Phenospex can now solve all these challenges and we combined the strength of 3D imaging with the power of spectral imaging in just one sensor – the PlantEye F500. The new PlantEye F500 measures the 3D shape in high resolution and combines it on the fly with a 4-channel multispectral camera in the range between 400 – 900nm. This unique hardware-based sensor fusion concept allows us to deliver spectral information for each data point of the plant in X, Y, and Z-direction. This spectral information can now be easily corrected for angles and distances from the sensor using this depth information.
How does it work?
To provide this unique kind of scanner we combined our existing imaging concept of PlantEye with a multispectral flash unit that illuminates the plant and measures up to 7 wavelengths immediately after the 3D acquisition of the plant in high frequency. In this way, we can overlay 3D and multispectral information in one combined dataset without the need for computationally complex sensor fusion algorithms and provide both morphological and physiological parameters. Of course, we keep all key assets of the PlantEye F400 model and PlantEye F500 also works in all environments and can be operated in full sunlight.
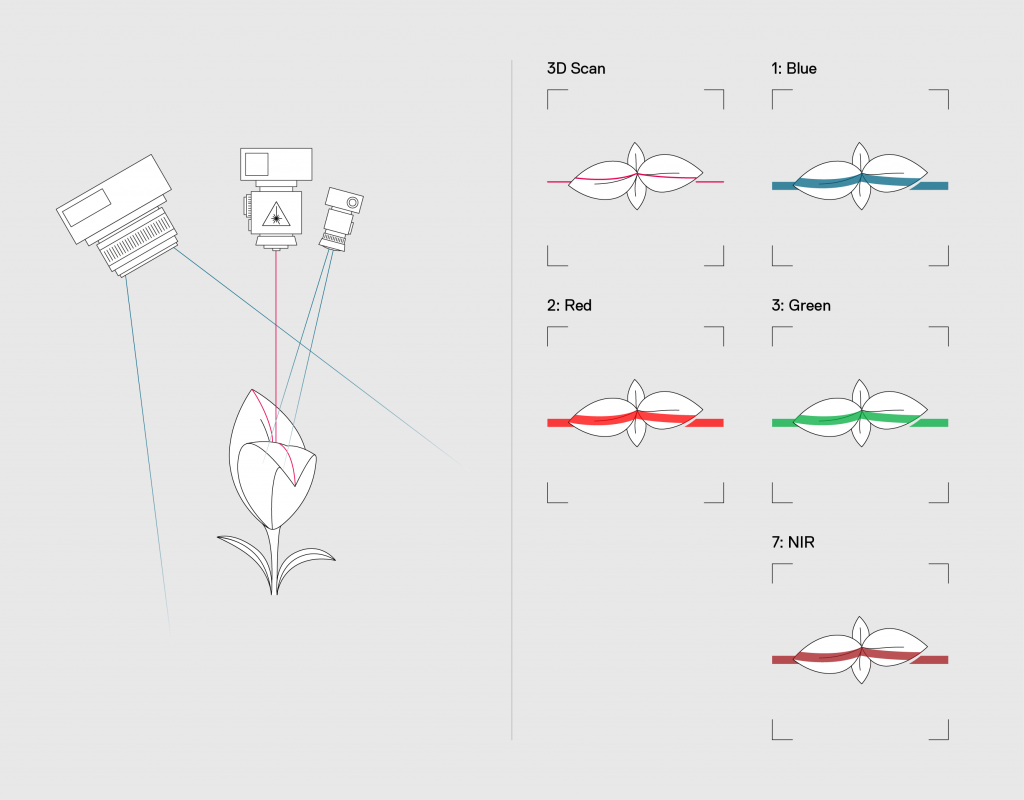
Measurement concept of PlantEye F500. In addition to the 3D scanning principle, PlantEye F500 adds a multispectral flash unit next to the laser. After acquiring the 3D information, this unit illuminates the scene with several colors. The images on the right show the view of the camera. For each color, one image is taken by the camera to measure the reflectance of the plant in that specific wavelength.
What can we measure?
Previous PlantEye generations can compute automatically a wide variety of morphological parameters such as: Plant height, 3D leaf area, Projected leaf area, Digital biomass, Leaf inclination, Leaf area index, Light penetration depth and Leaf coverage.
In addition to that, PlantEye F500 can now measure a spectral reflectance for each point of the plant. Each wavelength can be statistically analyzed individually to calculate greenness, chlorophyll-levels or to detect senescence. Next to that, wavelength can be combined to spectral indices such as Normalized Digital Vegetation Index (NDVI), Enhanced vegetation index (EVI), Photochemical Reflectance Index (PRI) and many others. The wavelength in which PlantEye measures can be selected from a selection of available bandwidths to match the research application. Each point of the point cloud generated by PlantEye (stored as an open PLY format) contains:
- X, Y, Z coordinates in space
- Reflectance in Red, Green, Blue, and Near-Infrared
- Reflectance of the 3D Laser (940nm)
- Customization of wavelength on demand
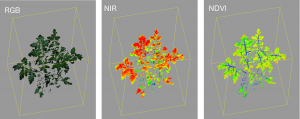
Example data acquired with PlantEye F500 from a young tomato plant. Left: RGB image composed of the Red, Green and Blue channel. Middle: Scalar image of a single NIR image (measured at 860nm). Right: NDVI index calculated using the Red and Green channels
The combination of 3D with multispectral information is also of great benefit for segmentation- and feature extraction processes. Spectral information can be used to segment 3D point clouds and vice versa, which makes feature extraction much easier and faster. This is especially interesting for applications where pace is important like in automated harvesting of fruits and vegetables.

